
Observations#
Observation Base#
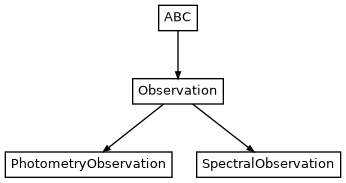
Abstract base class shared by all observation types.
- class ForMoSA.observation.observation_base.Observation(wave, flux, err, native_unit, facility, instrument, logger=None, log_level='INFO', display_unit=WavelengthUnit.MICROMETER, plot_config=ObsPlotConfig(cmap=<matplotlib.colors.LinearSegmentedColormap object>, color='#7A1E22', edgecolor='#551518', norm=<matplotlib.colors.Normalize object>, marker='s', markersize=40, linewidth=1, errorbar_fmt='None', errorbar_alpha=1.0, errorbar_capsize=4.0, zorder_data=3, zorder_error=1, label=True))[source]#
Bases:
ABCBase class for any observation (photometric or spectroscopic).
- Parameters:
wave (
ndarray) – Wavelength arrayflux (
ndarray) – Flux arrayerr (
ndarray) – Error arraynative_unit (
WavelengthUnit) – Native unit of the wavelength arrayfacility (
str) – Facility nameinstrument (
str) – Instrument namelog_level (
str) – Level of the loggingdisplay_unit (
WavelengthUnit) – Display unit of the wavelength arrayplot_config (
ObsPlotConfig) – Plot configuration for the observation
Notes
Authors: Allan Denis
- abstract property ObsType: <property object at 0x7d7380ea7150>#
Observation type.
- abstractmethod plot_data(fig=None, ax=None, ax_filt=None, draw_legend=True)[source]#
Plot the observation.
- Parameters:
fig (
Figure|None) – Figure (used to overplot on an existing figure)ax_filt (
Axes|None) – Ax used to overplot the transmission filter on an existing axdraw_legend (
bool) – Whether to draw the legend. Set to False when called from a parent function (e.g. plot_all) that manages the legend itself.
- Return type:
Notes
Authors: Allan Denis
- property unit: PrefixUnit#
Display unit of the wavelength array.
- property plot_config: ObsPlotConfig#
Configuration plotting.
- classmethod from_dict(data, logger=None, log_level='INFO', **kwargs)[source]#
Generate Observation from dictionary of data.
- Parameters:
- Return type:
- Returns:
Obervation – An instance of class Observation
Examples
>>> obs = Observation.from_dict(data, logger, log_level)
Notes
Authors: Allan Denis
- classmethod from_file(path, logger=None, log_level='INFO', **kwargs)[source]#
Generate Observation from a fits file.
- Parameters:
- Return type:
- Returns:
“Observation” – Instance of class Observation
Examples
>>> obs = Observation._from_file(path, logger, log_level)
Notes
Authors: Allan Denis
- classmethod from_attributes(logger=None, log_level='INFO', **kwargs)[source]#
Generation Observation from attributes.
- Parameters:
- Return type:
- Returns:
“Observation” – Instance of class Observation
Examples
>>> obs = Observation._from_attributes(**attributes, logger, log_level)
Notes
Authors: Allan Denis
Observation Loader#
Factory that creates Observation
instances from FITS files, dictionaries, or raw attributes.
Spectral Observation#
- class ForMoSA.observation.observation_spectroscopy.SpectralObservation(wave, flux, err, res, facility, instrument, native_unit, cov=None, transm=None, star_flux=None, system=None, logger=None, log_level='INFO', display_unit=WavelengthUnit.MICROMETER)[source]#
Bases:
ObservationSpectral observation class.
- Parameters:
wave (
ndarray) – Wavelength arrayflux (
ndarray) – Flux arrayerr (
ndarray) – Error arrayres (
ndarray) – Spectral resolution arrayfacility (
str) – Facility nameinstrument (
str) – Instrument namenative_unit (
WavelengthUnit) – Native unit of the wavelengthlog_level (
str) – Level of the loggerdisplay_unit (
WavelengthUnit) – Unit of the wavelength to display
Notes
Authors: Allan Denis
- property ObsType: ObservationType#
Observation type.
- plot_data(fig=None, ax=None, ax_filt=None, draw_legend=True)[source]#
Plot spectroscopic data.
- Parameters:
fig (
Figure|None) – Figure (used to overplot on an existing figure)ax_filt (
Axes|None) – Ax used to overplot the transmission filter on an existing axdraw_legend (
bool) – Whether to draw the legend. Set to False when called from a parent function (e.g. plot_all) that manages the legend itself.
- Return type:
- Returns:
fig (matplotlib.figure.Figure) – Updated figure
ax (matplotlib.axes._axes.Axes) – Updated ax
ax_filt (matplotlib.axes._axes.Axes) – Non updated ax_filt
Notes
Authors: Allan Denis
Photometry Observation#
- class ForMoSA.observation.observation_photometry.PhotometryObservation(wave, flux, err, instrument, facility, filter_id, native_unit, logger=None, log_level='INFO', display_unit=WavelengthUnit.MICROMETER)[source]#
Bases:
ObservationPhotometric observation class.
- Parameters:
wave (
ndarray) – Wavelength arrayflux (
ndarray) – Flux arrayerr (
ndarray) – Error arrayinstrument (
ndarray) – Instrumentfacility (
ndarray) – Facilityfilter_id (
ndarray) – Filter IDnative_unit (
WavelengthUnit) – native unit of the wavelengthlog_level (
str) – Level of the loggerdisplay_unit (
WavelengthUnit) – Unit of the wavelength to display
Notes
Authors: Allan Denis
- property ObsType: ObservationType#
Observation type.
- property Filter: ndarray[PhotometryFilter]#
Photometric filters.
- plot_data(fig=None, ax=None, ax_filt=None, draw_legend=True)[source]#
Plot photometric data.
- Parameters:
- Return type:
- Returns:
fig (matplotlib.figure.Figure) – Updated figure
ax (matplotlib.axes._axes.Axes) – Updated ax
ax_filt (matplotlib.axes._axes.Axes) – Updated ax_filt
Notes
Authors: Allan Denis
Observation Set#
Container that groups multiple observations together.
- class ForMoSA.observation.observation_set.ObservationSet(logger=None, log_level='INFO')[source]#
Bases:
objectContainer for a set of Observation objects.
Notes
Authors: Allan Denis
- property observations: list[Observation]#
List of observations.
- property spectral_observations: list[SpectralObservation]#
List of spectroscopic observations.
- property photometry_observations: list[PhotometryObservation]#
List of photometric observations.
- property high_contrast_observations: list[Observation]#
List of high-contrast observation.
- classmethod from_npz(path, logger=None, log_level='INFO')[source]#
Create an instance of ObservationSet from a path containing observation fits files.
- Parameters:
- Return type:
- Returns:
“ObservationSet” – An instance of ObservationSet
Notes
Authors: Allan Denis
- classmethod from_fits(path, logger=None, log_level='INFO')[source]#
Create an instance of ObservationSet from a path containing observation fits files.
- Parameters:
- Return type:
- Returns:
“ObservationSet” – An instance of ObservationSet
Notes
Authors: Allan Denis
- classmethod from_dict(data, logger=None, log_level='INFO')[source]#
Reconstruct an ObservationSet from a dictionary of ObservationSet.
- Parameters:
- Return type:
- Returns:
‘ParameterSet’ – An instance of class ParameterSet
Notes
Authors: Allan Denis
- classmethod from_json(path, logger=None, log_level='INFO')[source]#
Reconstruct an ObservationSet from a json file.
- Parameters:
- Return type:
- Returns:
‘ParameterSet’ – An instance of class ParameterSet
Notes
Authors: Allan Denis
- classmethod from_list(obs_list, logger=None, log_level='INFO')[source]#
Reconstruct an ObservationSet from a list of observations.
- Parameters:
obs_list (
list[Observation]) – List containing observationslog_level (
str) – Level of the logging
- Return type:
- Returns:
‘ParameterSet’ – An instance of class ParameterSet
Notes
Authors: Allan Denis
- add_observation(*args, **kwargs)[source]#
Add an observation to the set based on the type of data provided.
- Parameters:
args –
If a Observation object is provided, directly add the observation
If a .fits file is provided, provide a single argument path (str | Path)
If a dictionary of data is provided, provide a single argument data (dict)
If attributes are provided, provide the necessary arguments to create the observation (Spectral or Photometric)
kwargs (Additional attributes for the observations if necessary.)
Example
self.add_observation(path="path/to/file.fits") (-)
self.add_observation(data={"wavelength" (-)
self.add_observation(name="spectral_obs" (-)
wavelength=...
flux=...
...)
Notes
Authors: Allan Denis
- save_all(path, to_json=False)[source]#
Save all observations to disk as .npz files.
- Parameters:
- Return type:
Notes
Authors: Allan Denis
- adapt_all(target_resolution, wave_cont=None, res_cont=None)[source]#
Adapt all observations to the target resolution.
- Parameters:
- Return type:
Notes
Authors: Simon Petrus, Matthieu Ravet and Allan Denis
- to_json(path)[source]#
Save the set of observations to a given path as a json file.
Notes
Authors: Allan Denis
- plot_all(fig=None, ax=None, ax_hc=None, ax_filt=None)[source]#
Plot all the observations and photometric filters.
- Parameters:
fig (
Figure|None) – Figure (used to overplot on an existing figure)ax (
Axes|None) – Ax (used to overplot non-high-contrast observations)ax_hc (
Axes|None) – Ax used to overplot high-contrast observations. When None and ax is provided, HC observations fall back to ax (e.g. inside plot_fit).ax_filt (
Axes|None) – Ax used to overplot the transmission filter
- Return type:
- Returns:
fig (matplotlib.figure.Figure) – New Figure object
ax (matplotlib.axes._axes.Axes) – New Ax object
ax_filt (matplotlib.axes._axes.Axes) – New ax object for photometric filters
Notes
Authors: Allan Denis